“Developed country” usually evokes places with mature economies, advanced infrastructure, and high living standards, but the reality is more nuanced because different institutions measure different things and for different purposes. The UNDP’s Human Development Index (HDI) blends health, education, and standard‑of‑living indicators into a 0–1 scale, where top‑ranked countries cluster around 0.95–0.97, signaling very high human development and broad access to life‑enhancing capabilities beyond GDP alone. By contrast, market and finance bodies (e.g., World Bank, FTSE Russell) classify economies by income or by capital‑market openness and efficiency, so “developed” can mean one thing for quality of life and another for market status or investability.
HDI: what it measures and why it’s widely used
The HDI is a composite of life expectancy (health), education (schooling years), and gross national income per capita, normalized into a single score that allows meaningful cross‑country comparison of human development outcomes each year. UNDP’s 2023/24 Human Development Report emphasizes that post‑pandemic recovery has been uneven, with many high‑income countries exceeding pre‑2020 HDI levels while lower‑income countries lag, reminding readers that HDI is comparative and dynamic, not static. In popular usage, countries in the highest HDI band are often equated with “developed,” even though the UNDP formally groups them as “very high human development” rather than applying a binary label.
2023 HDI leaders (illustrative snapshot)
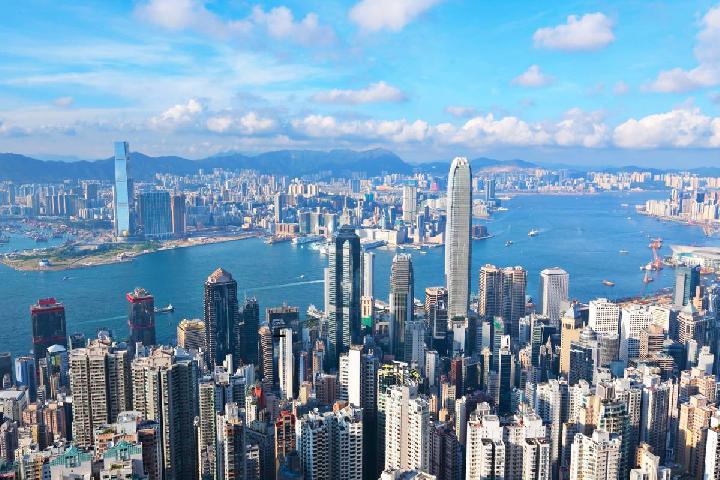
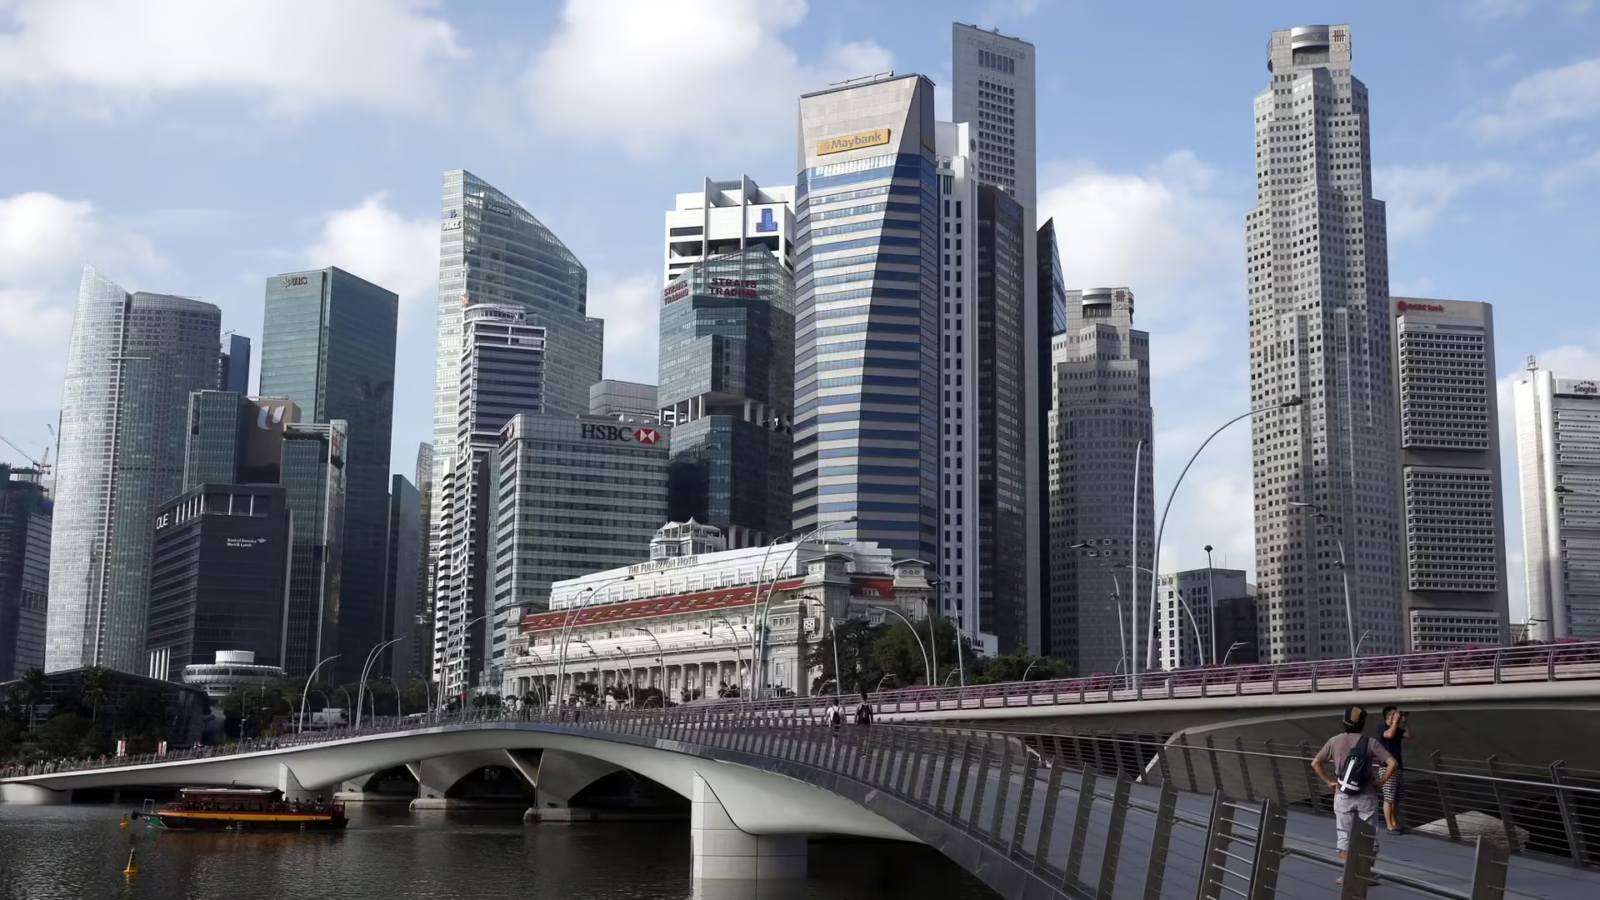
World Population Review’s synthesized list (sourced to UN data) shows a familiar top tier led by Iceland, Switzerland, and Norway, followed closely by Denmark, Germany, and Sweden, all with HDI above roughly 0.95 in 2023—levels associated with long lives, extensive education, and high incomes. This top cohort broadly aligns with the countries most people recognize as “developed,” yet the list also features small advanced economies and city‑states, highlighting that population size is not a prerequisite for high human development. Even within this group, differences of a few hundredths in HDI can reflect meaningful gaps in schooling, longevity, or income when tracked over time, so small rank changes can still be policy‑relevant.
Top 10 by HDI (2023)
| Country | HDI 2023 |
|---|---|
| Iceland | 0.972 |
| Switzerland | 0.970 |
| Norway | 0.970 |
| Denmark | 0.962 |
| Germany | 0.959 |
| Sweden | 0.959 |
| Australia | 0.958 |
| Netherlands | 0.955 |
| Hong Kong | 0.955 |
| Belgium | 0.951 |
Why “developed” differs across institutions
- World Bank income groups: Countries are categorized as low, lower‑middle, upper‑middle, or high‑income based on GNI per capita thresholds updated annually, a framework designed for macroeconomic analysis and lending eligibility rather than well‑being per se.
- FTSE/market classification: FTSE Russell assigns “Developed,” “Advanced Emerging,” “Secondary Emerging,” or “Frontier” based on capital‑market criteria like market size, liquidity, and accessibility—hence a country can have high HDI but remain “emerging” if its market infrastructure doesn’t meet developed‑market standards.
- MSCI methodology: Annual reviews similarly evaluate market openness and investability, so MSCI’s “developed” or “emerging” tags track equity‑market realities rather than social outcomes, diverging from HDI logic by design.
The Türkiye example: one country, many labels
World Population Review notes that Türkiye’s HDI in the 0.83–0.85 range places it well above many peers on human development, which supports a colloquial “developed” label in some arenas, particularly given its G20 status and diversified economy. Yet FTSE Russell lists Türkiye as an “Advanced Emerging” market and the World Bank classifies it as upper‑middle income, illustrating how income thresholds and market criteria can yield a different picture than people‑centric HDI outcomes. This divergence is not an error; it reflects distinct goals—investors need to know about market accessibility, while human development practitioners track well‑being progress and equity in opportunities.
What HDI captures well—and what it doesn’t
HDI’s strength is simplicity: three pillars—health, education, and income—summarize life chances in ways the public and policymakers can readily interpret year to year across countries and regions. However, HDI is not a measure of inequality, environmental sustainability, democratic quality, or subjective life satisfaction, though UNDP publishes complementary indices (e.g., inequality‑adjusted HDI) and thematic metrics to fill some gaps where data permit. As such, calling a country “developed” based solely on HDI can blur important differences in climate resilience, governance, or inclusive growth—areas that may matter just as much to residents and investors.
How readers can use the 2023 HDI list
For quality‑of‑life comparisons, the 2023 HDI list offers a clean, human‑centered snapshot: countries above roughly 0.90 typically exhibit long life expectancy, broad access to advanced schooling, and high incomes, with public services and infrastructure to match. For policy benchmarking, year‑over‑year movement in HDI components can signal whether gains are coming from health, education, or income and where targeted reforms might deliver the biggest welfare improvements next. For investment or migration questions, HDI should be paired with market classifications and income group data to ensure the “developed” label aligns with the decision context—finance, livelihoods, or public services.

A quick note on labels and lived reality
“Developed” and “developing” are convenient shorthand, but UNDP steers discourse toward “very high,” “high,” “medium,” and “low human development,” which avoids binary traps and better reflects gradients of well‑being progress. Meanwhile, the World Bank’s income groups and FTSE/MSCI market statuses remain indispensable for economic analysis and portfolio construction, so it’s normal—and appropriate—for the same country to carry different labels across these systems. Ultimately, residents experience development through services, security, education, and health outcomes—precisely the basket HDI tracks—so pairing these lenses yields the most accurate, actionable picture.
Conclusion
The latest rankings place Iceland, Switzerland, and Norway at the top of global human development, with many European, Australasian, and East Asian economies clustered in the very‑high range around 0.90–0.97 on the 2023 HDI scale—a profile commonly associated with “developed countries” in everyday language. Still, “developed” is not a universal standard; the UNDP’s HDI emphasizes life chances, the World Bank focuses on national income, and FTSE/MSCI judge capital‑market maturity, which is why a country can be “developed” on one axis and “emerging” on another without contradiction. For serious comparisons or decisions, treat “developed” as a family of metrics: use HDI for quality‑of‑life signals, pair it with World Bank income groups and market classifications, and always read the movement in components over time rather than relying on a single headline number or rank.


Leave a comment